By: Dana Sackett
Above is a passage from an article I previously wrote on compounds that interfere with the endocrine system (or endocrine disruptors; usually hormones or chemicals that act like hormones). This week I wanted to share the results of the study I eluded to in that excerpt.

First though, let me explain why and how we started the study. We wanted to see if we could predict the relative amount of estrogenic compounds in the water using publicly available information on the sources of these compounds. In doing this, we hoped to identify “hotspots” where the levels were higher.

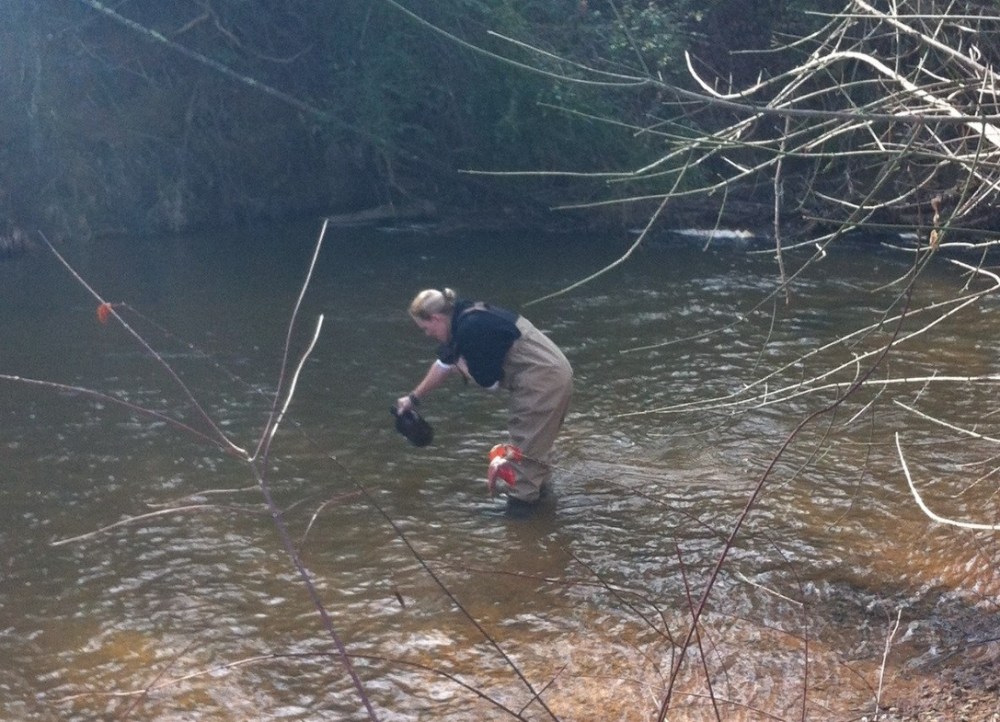
Because sampling and testing for contamination can be very expensive, being able to identify “hotspots” with a model would allow North Carolina to efficiently focus resources on those areas that are the most concerning. However, to know if our predictions were correct we had to compare our predictions to the actual levels of estrogenic compounds in the water (that is where all the driving and water sampling came into play).

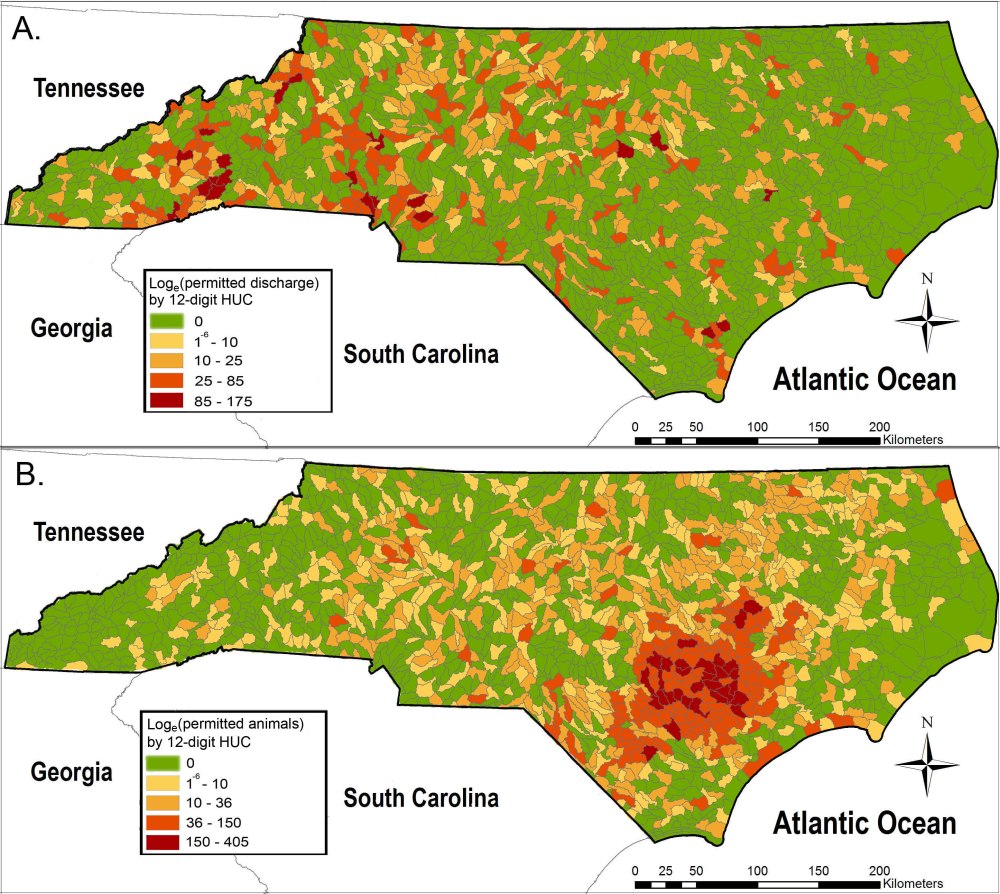
To make these predictions, we identified and mapped all of the places where estrogenic compounds were being discharged into our water (see figure above). Many of these sources are related to human and animal waste because many humans and farm animals consume and then excrete hormones (like birth control pills or hormone treatments). Sources included waste water treatment plants, agricultural areas where human sewage is applied to the land, farms with confined animal feeding operations, and superfund sites that had links to chemicals that were known to be estrogenic. We then added together the relative amount of estrogenic affect from these sources in each sub-watershed (see figures below).
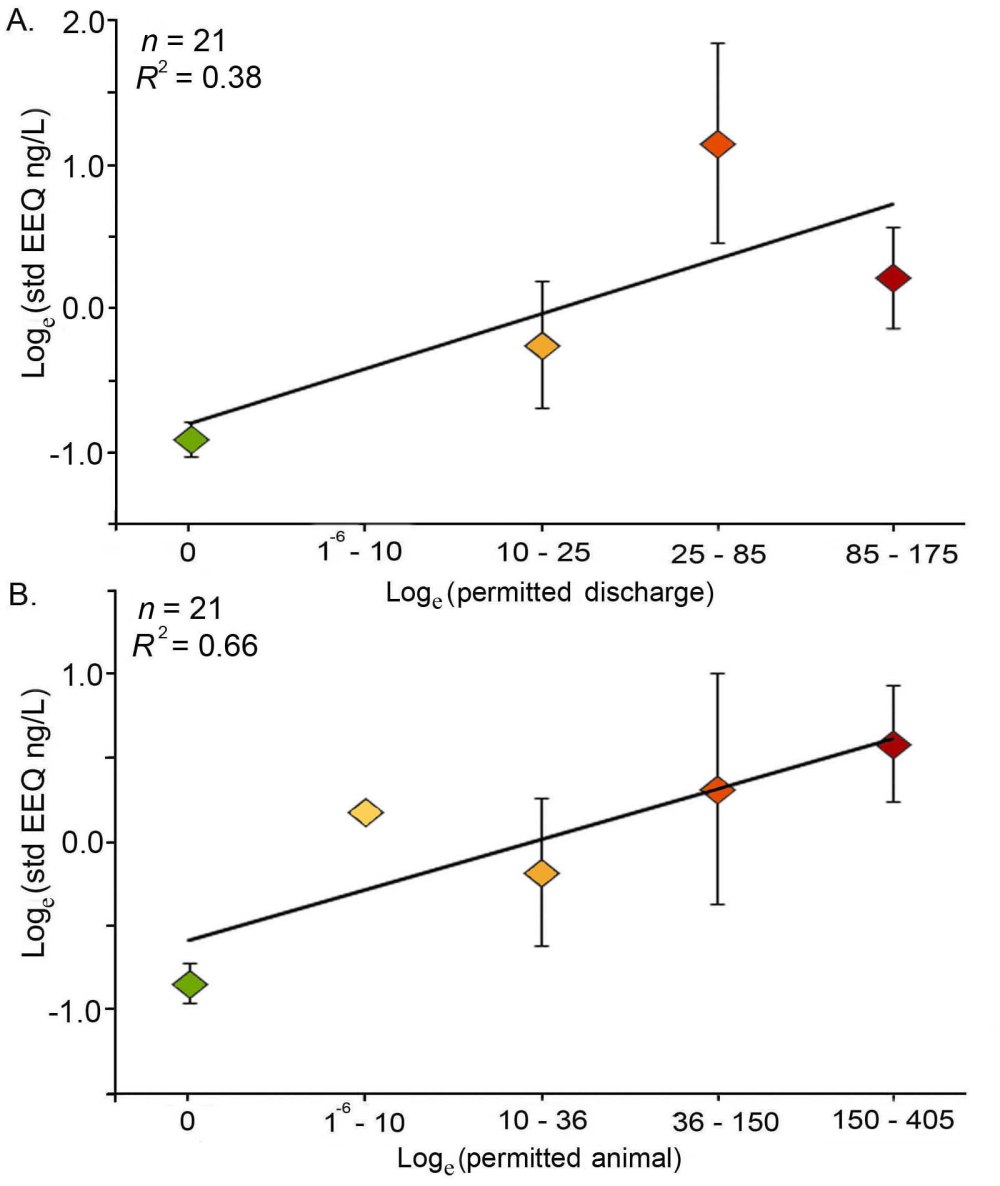
After creating these maps we selected sample sites across the state that ranged from areas predicted to be relatively unimpacted to highly impacted by estrogenic compounds. We also choose sites that were associated with different types of sources (nonpoint sources, such as agriculture, versus point sources, such as wastewater treatment). At each of these sites we collected water and measured the level of estrogenic compounds.

It turns out that our model did a pretty good job of predicting the relative level of estrogenic compounds in the water and could be used to identify areas highly impacted by these compounds. In addition, reference sites (predicted to have little to no impact from estrogens) had significantly lower estrogenic levels than both point and nonpoint sources.
Our study used readily available permit data to identify waterbodies impacted by estrogenic compounds throughout North Carolina. Adverse health effects for fish, wildlife and people from estrogenic compounds demonstrate our need to better manage these compounds. This study provided an important first step in developing a management strategy to meet this need and we hope that other areas will take a similar approach to identify “hotspots” more likely to have concerning levels of estrogenic compounds in water.
References:
Sackett DK, Lee Pow C, Rubino MJ, Aday DD, Cope WG, Kullman S, Rice JA, Kwak TJ, Law M. 2015. Sources of endocrine disrupting compounds in North Carolina waterways: A geographic information systems approach. Environmental Toxicology and Chemistry 34:437-445.
