By: Dana Sackett
For environmental scientists and biologists, there are some terms and phrases so commonly used that they become a part of everyday conversations. Trophic position is one of those terms that is often used in daily conversations without the realization that many do not have a clear idea of what it means. This article explains what trophic position is and discusses some of the newer ways that scientists measure it.


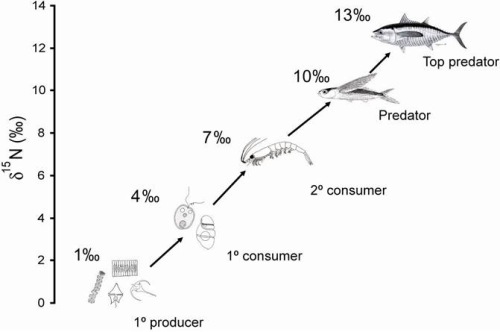
To talk about trophic position, we first have to define “food web”. A food web is the feeding relationships within a community; basically a “who eats who” diagram. This is different than a food chain, which only shows a single path through a food web. Trophic position, sometimes called trophic level, are terms that refer to the position an organism occupies in the food web. For instance, a primary producer (anything that can make its own food) like algae or plants, would be at the base or beginning of a food web, having a trophic position of 1. Anything that eats only things from trophic level 1 (algae, phytoplankton, or plants) would have a trophic level of 2 (herbivores or primary consumers) and anything that ate only things from level 2 (animals that ate only plants) would have a trophic positon of 3 (secondary consumer), and so on. Things get a little bit more complicated when animals eat more than just one food from a single level, which many do.

Trophic position can be evaluated in a number of different ways. One way is to have a fish regurgitate its meal after being captured and then examine the contents of its stomach. Sounds gross, I know, but only because it is. In fact, there are likely whole groups of undergraduates, technicians, and graduate students sitting in a lab somewhere right now sorting through the stomach contents of fish in large metal trays with microscopes and field guides on hand to accurately identify half-digested invertebrates and fish. As the stomach contents of various fish are identified, the puzzle of “who eats who” can slowly be mapped out. One limitation, however, is that the stomach contents of a fish are only a snapshot of what the fish had, only recently, been eating. Also, some food items are often too deteriorated to identify and others, that digest very quickly, may never be seen. Lastly, this process is very time consuming, requiring long-hours and lots of students (or one very dedicated one).

Another way researchers can calculate the trophic position of fish is to examine the ratio of heavy to light nitrogen isotopes measured in a muscle tissue sample. You may remember that an element is determined by the number of protons it has. For instance, nitrogen has 7 (that’s why it is number 7 on the periodic table). Elements also typically have neutrons. When an element has different forms with different amounts of neutrons, say one or two extra, those different forms are called isotopes. Isotopes can be stable or unstable (radioactive). Stable nitrogen isotopes have the same properties but different atomic masses; meaning there are heavier (15N) and lighter (14N) forms of nitrogen.

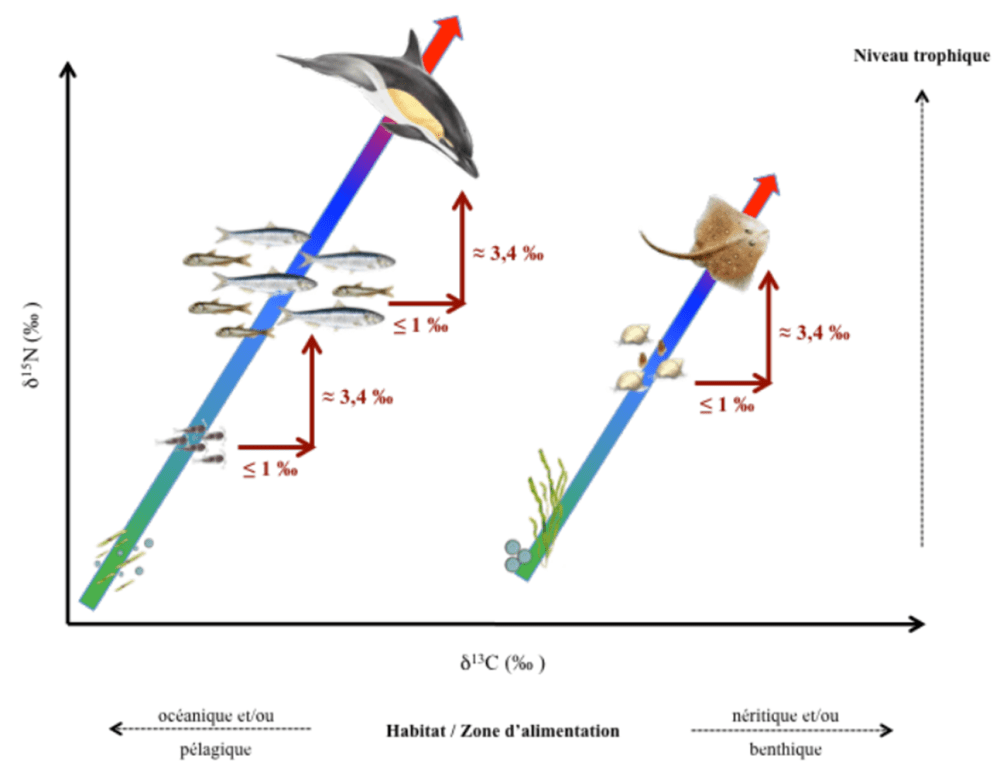
When a chemical reaction uses one isotope of an element preferentially over another, it is called fractionation and will lead to different proportions of the different isotopes after the chemical process occurs. For trophic position, when an organism is eaten, the nitrogen from the prey is used for biological processes with the lighter form being used more often and lost to waste (in other words they pee out more of the lighter form of nitrogen and retain more of the heavy form). The percent of the heavy to light forms of nitrogen that remain in the muscle of an organism will then grow with each step in the food web. Researchers can then calculate what is called a delta (δ) isotope value using the ratio of heavy to light nitrogen for the fish sample and a relative standard. Because there is a very reliable increase in this value with each step in the food web, it can then be used to calculate trophic position.
One limitation of this process is that you need to know the starting point, or the ratio of the heavy to light forms of nitrogen at the base of a food web. This limitation is not that important if all of the species you are interested in come from the same food web (say in a small lake). But if you would like to compare different lakes or ecosystems you need to know what the ratio of the heavy to light nitrogen was when is entered each food web. Measuring the nitrogen isotope values of the primary producers, or invertebrates that eat primary producers, from each system would provide this baseline value.
But what if you need to know this baseline value for a marine species that can swim across the ocean? What do you test? Luckily there is another way to estimate this baseline value. The nitrogen isotope ratio tested in muscle tissue can be broken down into the amino acids that make-up that sample. Because the nitrogen in some amino acids only fractionate very slightly with an increase in trophic position, they have the same or a very similar ratio of heavy to light nitrogen that was present at the base of that fish’s food web.

Using amino acid nitrogen isotopes is one of the more novel and exact ways to estimate an organism’s trophic position. A limitation to this method is the expense. But when compared to the cost of hours of labor by numerous students looking at diets for months on end, it might be worth it. However, while nitrogen isotopes can tell you the exact trophic position of an array of organisms in an ecosystem and help piece food webs together, it cannot tell you exactly what an organism ate to be at that trophic level. Thus, to the chagrin of undergrads, technicians, and graduate students, the days of sorting through half-digested fish stomach contents will likely always be needed to some extent.
References and other reading material:
Bradley CJ, Wallsgrove NJ, Choy CA, Drazen JC, Hetherington ED, Hoen DK, Popp BN. 2015. Trophic position estimates of marine teleosts using amino acid compound specific isotopic analysis. Limnology and Oceanography 13: 476-493.
Chikaraishi Y, Ogawa NO, Kashiyama Y, Takano Y, Suga H, Tomitani A, Miyashita H, Kitazato, H, Ohkouchi N. 2009. Determination of aquatic food-web structure based on compound-specific nitrogen isotopic composition of amino acids. Limnology and Oceanography. Methods 7, 740–750.
Choy CA, Davison PC, Drazen JC, Flynn A, Gier EJ, Hoffman JC, McClain-Counts JP, Miller TW, Popp BN, Ross SW, Sutton TT. 2012. Global trophic position comparison of two dominant mesopelagic fish families (Myctophidae, Stomiidae) using amino acid nitrogen isotopic analyses. PLoS ONE 7, e50133.
France R. 1995. Stable nitrogen isotopes in fish: literature synthesis on the influence of ecotonal coupling. Estuarine, Coastal and Shelf Science 41:737-742.
Minagawa M, Wada E. 1984. Stepwise enrichment of 15 N along food chains: Further evidence and the relation between 15 N and animal age. Geochimica et Cosmochimica Acta 48:1135-1140.
Nielsen JM, Popp BN, Winder M. 2015. Meta-analysis of amino acid stable nitrogen isotope ratios for estimating trophic position in marine organisms. Oecologia. DOI 10.1007/s00442-015-3305-7.
Peterson BJ, Fry B. 1987. Stable isotopes in ecosystem studies. Ann Rev Ecol Syst 18:293-320.
Post DM. 2002. Using stable isotopes to estimate trophic position: Models, methods, and assumptions. Ecology 83:703-718.
Post DM, Layman CA, Arrington DA, Takimoto G, Quattrochi J, Montana CG. 2007. Getting to the fat of the matter: models, methods and assumptions for dealing with lipids in stable isotope analyses. Oecologia. 2007, 152, 179-189.
Sherwood OA, Lehmann MF, Schubert CJ, Scott DB, McCarthy, MD. 2011. Nutrient regime shift in the western North Atlantic indicated by compound-specific δ15N of deep-sea gorgonian corals. PNAS 103 1011–1015, doi: 10.1073/pnas.1004904108
Vander Zanden MJ, Rasmussen JB. 2001. Variation in delta15N and delta13C trophic fractionation: Implications for aquatic food web studies. Limnology and Oceanography 46:2061-2066.
A good video describing isotopes and fractionation
